Log Insight for VMware Integrated OpenStack
vRealize Log Insight is not a product I have had much to do with up to now, but that changed a few days ago when I was asked to perform an evaluation of how Log Insight might help with the management and administration of VMware Integrated OpenStack environment.
So lets start what is vRealize Log Insight, in essence it is a tool for aggregating the viewing of all the log files from all aspects of your infrastructure. It delivers real-time log management, with machine learning-based Intelligent Grouping, and high performance search. While it is a VMware product it is fully extensible and can receive log files from any product, the product vendor then writes a Log Insight content pack to give the intelligence to identify good and problem states.
The environment I was given already had Log Insight 2.0A deployed, some of the content packs I was exploring for VMware Integrated OpenStack required the latest Log Insight 2.5. Here I detail the ‘how to’ steps I followed for upgrading Log Insight and then adding the content packs.
Log Insight 2.0A to 2.5 Upgrade
The OpenStack content pack only supports Log Insight 2.5, so to install this my first task is to upgrade Log Insight itself, this is is surprisingly easy. Simply obtain a copy of the vRealize Log Insight upgrade bundle .pak file from VMware Downloads.
Connect to Log Insight as admin, once connected select ‘Administration’ from the menu icon in very top right corner, upload PAK file, click Upgrade.

Installing OpenStack Log Insight Content Pack
There are two methods for installing content packs, the first is via the Log Insight itself, it has a market place feature which connects to the internet to get the list of available Content Packs you then click install and the tool does the rest. While my test environment had internet access I could have used this, but as most production workload is isolated from internet instead I opted for the offline method. The OpenStack content pack is downloadable from Solutions Exchange. It comes as a small zip file, within the zip is a vlcp file, extract this.
Connect to Log Insight as admin, once connected select ‘Content Packs’ from menu icon in very top right corner, select ‘Import Content Pack’, you get the option now to install as a content pack (available to all) or into my content (available only to user importing). Click Browse and find the extracted OpenStack vlcp file and click Import.
I was surprised to find that the content pack did not require configuring with keystone location or credentials, I assume it picks these up from something VIO adds to vCenter, but it just worked which is great.
Installing NSX Log Insight Content Pack
VMware Integrated Openstack uses NSX-MH, so I installed NSX content pack, it didn’t appear to get any data, I was surprised to find when looking a little closer and speaking to our TAM that the current version of the content pack (v1.0) is NSX-V only.
Installing Arista-EOS Switch Log Insight Content Pack
Our VMware Integrated Openstack uses Arista EOS switches, these integrate with NSX, and Arista provide Content Pack, I used the same method as above to add the content pack to Log Insight.
The Arista EOS switches don’t support Log Insight by default but they are extensible and Arista provide a Log Insight agent by way of an rpm file, this is copied and installed to all of the switch’s and the loginsight.yaml file is then updated with the IP address of Log Insight server and the level of logging to perform.
Exploring Log Insight
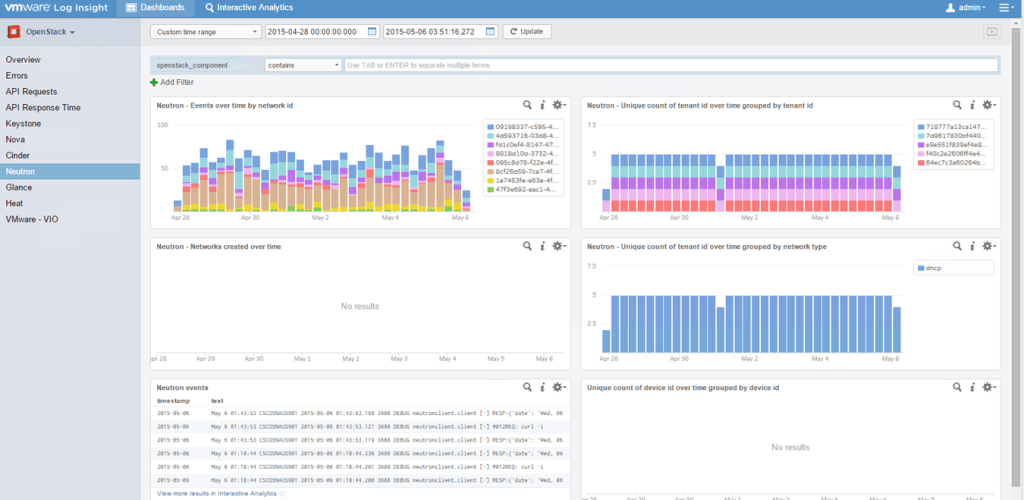
Having the power to look across every log file in the estate from a single pane of glass is hard to quantify until you start to work through an issue. The thing VMware have succeeded in doing with this product is keeping the view as clean and uncluttered as possible but still giving all and more of the required functionality. All content packs provide a default dashboard view constructed to highlight the areas of there product which they believe would be of interest. Navigation in the dashboard view between content packs is via a menu at the top of the left pane, once selected the left pane gives all of the sub dashboards you can see here OpenStack provides eleven dashboards one for each project.

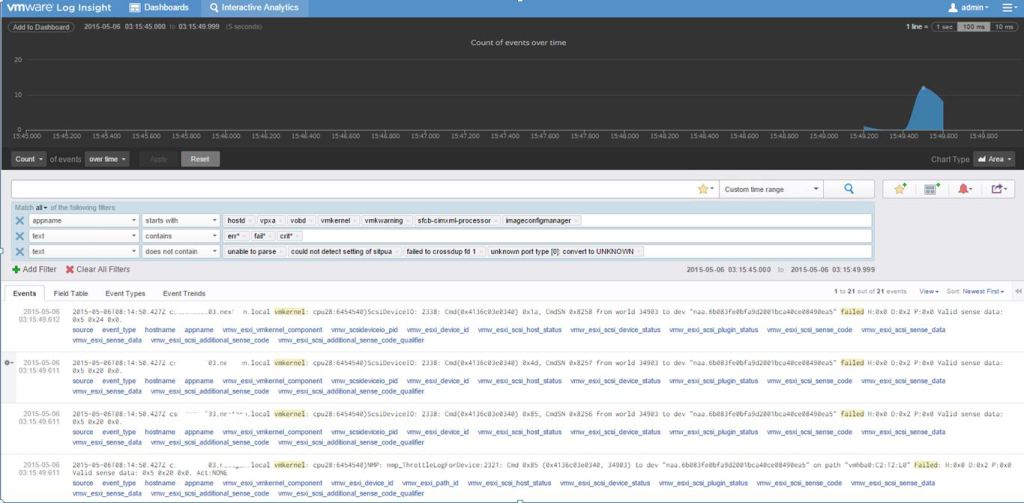
You can use these dashboards to get a general idea about health, but also you’ll have occurrences where users report an issue and you need to investigate. Maybe a incident ticket got logged and it took a day or so to come through to you, the dashboards show default last five minutes, these can be set to show last hour, last six hours or last twenty four hours, but the most useful might be a custom time window. The custom time window could be used to pick the day the issue occurred and it would update the dashboard to show what was going on in the log files at that time. Here you might see a spike in events and want to drill in to the detail, so you can just click on the spike and change to interactive view and it will display all the log entries for all components being managed which relating to that spike.

Once in the interactive view you have several options in the bottom pane to adjust the view, the default view is ‘Events’ as name suggests this lists all event entries. If you change to ‘Field Table’ this gives a little more structure to the view by separating out each part into a column. The ‘Event Types’ view collapses the Events by Type so if you have like 100 errors, this view might show that there are only 3x types of error and that 70 are of type 1, 20 type 2 and 10 of type 3. The ‘Event Trends’ is as a progression from ‘Events by Type’ and shows the collapsed view but shows which are trending into decline and which are trending up in occurrence.
Real Life Usage
Its hard to quantify how useful Log Insight can be until you have to work through a proper issue. Luckily (well maybe not lucky to get a fault) while looking at Log Insight a fault manifested itself to users in OpenStack Horizon that they could not deploy new VM instances. I opened the Log Insight OpenStack content pack and without any awareness of the components of openstack could see nova had been reporting issues at the time the issues reported. The error messages were very generic and not leading to pointing to the fault so I went to the vSphere content pack and found messages which correlated to the time in nova which showed a ESXi host was having issues with clomd and suggested it needed restarting. CLOMD (Cluster Level Object Manager Daemon) plays a key role in the operation of a VSAN cluster so I checked VSAN dashboard in the content pack and could see other issues. I then connected to the ESX host restarted clomd and the issue went away, all this took about 5 minutes. When I took a step back to think about this, I had queries the log files of about 20-30 servers and was able to stay focused on the issue and the pattern of the fault rather than on logging on to the servers and finding the log files. Bear in mind I’m not Log Insight expert this was my first day using it and its ease of use coupled with its power makes it a truly wonderful tool for the administrator.