NSX-T for Planespotter
Moving towards application centric infrastructure suitable for microservices applications requires a good example application to work with. I saw an NSX demo presented by Yves Fauser where he used just such an application called planespotter.
My first task towards understanding this more was to get this setup in my homelab and look at it in context of NSX-T.
Homelab Core
My homelab networking is very simple, I have a domestic BT broadband router, this connects a Cisco SB200 8-port L2 only switch. Each port connected to ESXi is configured with MTU 9216 and has the VLAN passed untagged.
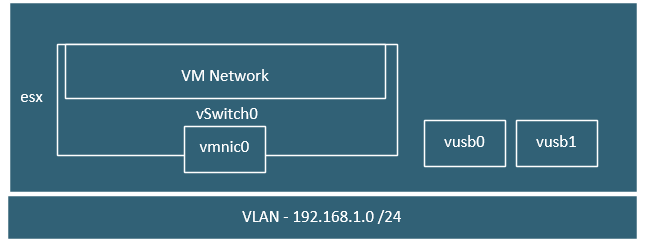
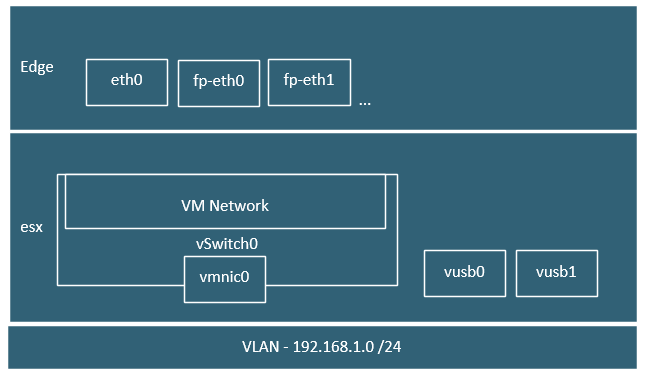
Connected to this are a pair of Intel NUCs each has onboard 1GB NIC and two USB 1GB NICs. The lab is used for other things so the on-board vmnic0 NIC is assigned to a VSS which has default ‘VM Network’ portgroup. This leaves both vusb0 and vusb1 free to be used for N-VDS.

The NUCs are single socket, dual core i5s running at 1.8GHz and each has only 32GB of RAM, these currently run vSphere 6.7 Update 1 and shared storage is all-flash VSAN with no data protection.
NSX-T Base
Download OVA’s and perform initial deployment of NSX Manager, NSX Controller and NSX Edge. As lab only has a single L2 all get deployed with all vNICs connected to the portgroup ‘VM Network’.

NSX-T Routing
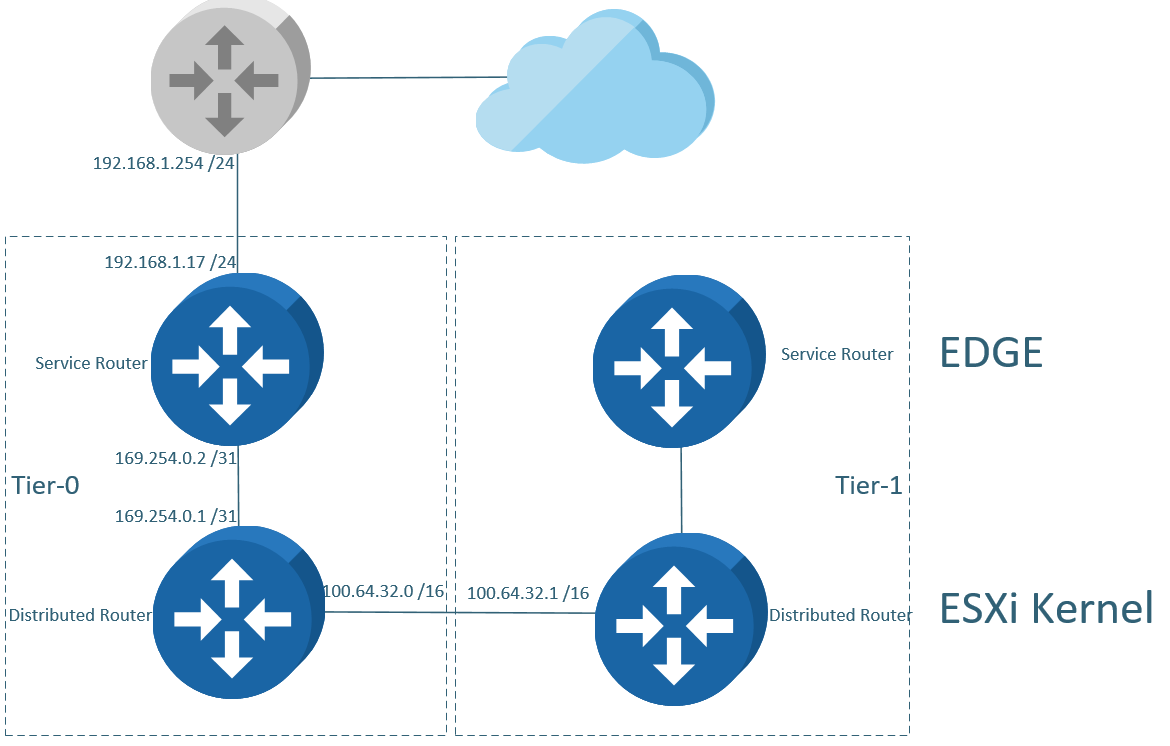
One of the biggest differences between NSX for vSphere and NSX-T is the routing architecture. The services are split between service router (SR) and distributed router (DR), the service router functions are run on the NSX edge and the distributed router (DR) is a kernel module running on the ESXi hosts. My lab setup uses defaults for all transit switches, it is importanrt to understand the relationship when we look at packets flow through these various hops.

Planespotter
The planespotter application is made up of various microservices and database. For this NSX-T setup each is installed on a VM. The application can be installed by following this guide.

Planespotter FE to API Traceflow
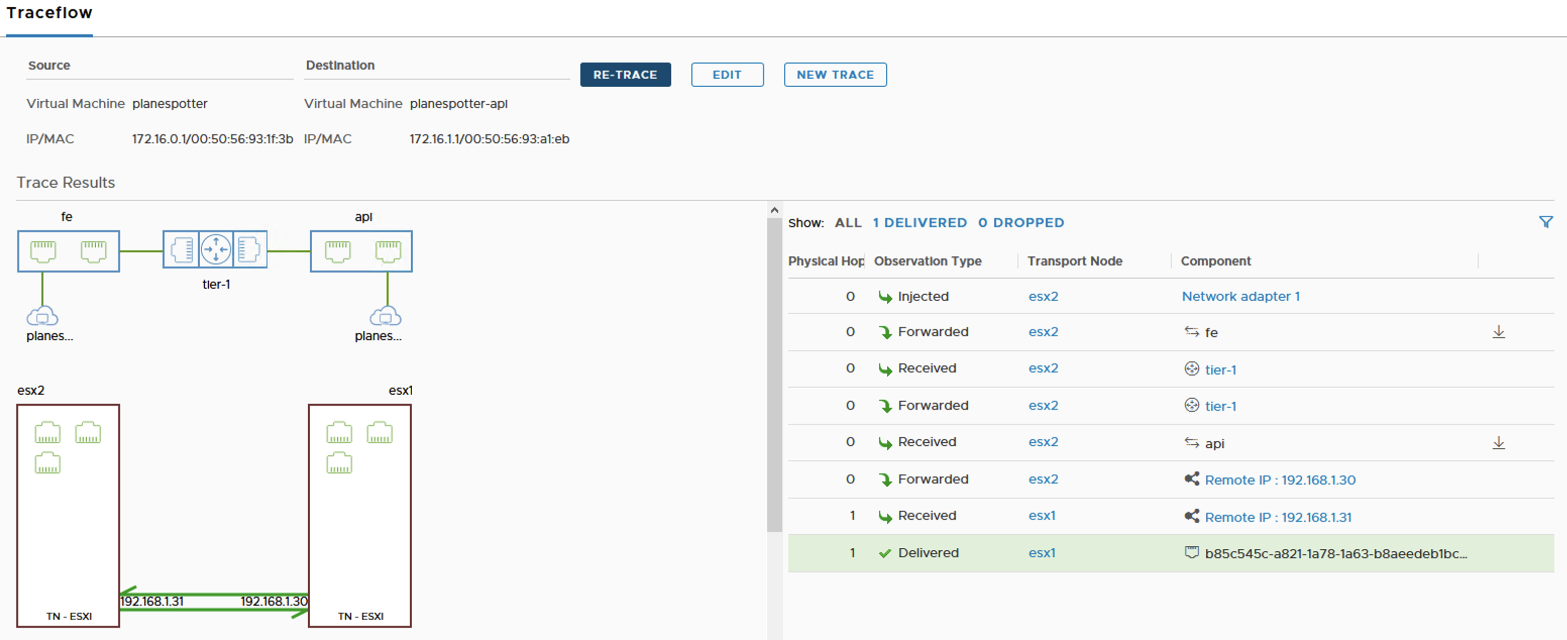
One neat feature of NSX-T and geneve is to inject data into the header and use this to trace flows. The traceflow feature helps inspect the path of a packet as it travels from one logical port to a single or multiple logical ports.
So if we select the port connected to planespotter frontend and port connected to planespotter api, we get a nice visual represenation of the path.
